Plot the regression model generated by the function ge_reg.
Usage
# S3 method for class 'ge_reg'
plot(
  x,
  var = 1,
  type = 1,
  plot_theme = theme_metan(),
  x.lim = NULL,
  x.breaks = waiver(),
  x.lab = NULL,
  y.lim = NULL,
  y.breaks = waiver(),
  y.lab = NULL,
  leg.position = "right",
  size.tex.lab = 12,
  ...
)
Arguments
- x
An object of class
ge_factanal- var
The variable to plot. Defaults to
var = 1the first variable ofx.- type
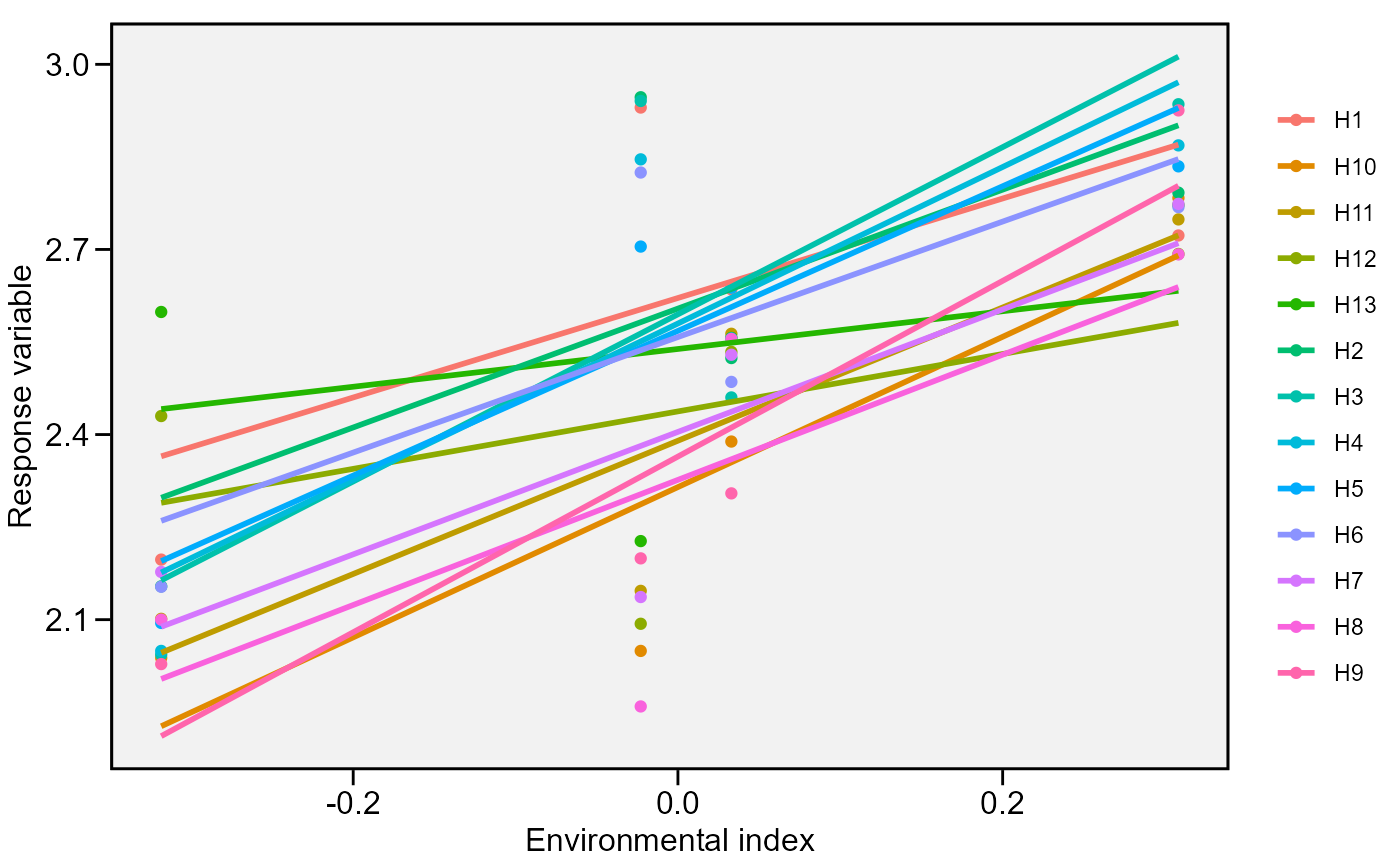
The type of plot to show.
type = 1produces a plot with the environmental index in the x axis and the genotype mean yield in the y axis.type = 2produces a plot with the response variable in the x axis and the slope/deviations of the regression in the y axis.- plot_theme
The graphical theme of the plot. Default is
plot_theme = theme_metan(). For more details, seeggplot2::theme().- x.lim
The range of x-axis. Default is
NULL(maximum and minimum values of the data set). New arguments can be inserted asx.lim = c(x.min, x.max).- x.breaks
The breaks to be plotted in the x-axis. Default is
authomatic breaks. New arguments can be inserted asx.breaks = c(breaks)- x.lab
The label of x-axis. Each plot has a default value. New arguments can be inserted as
x.lab = "my label".- y.lim
The range of x-axis. Default is
NULL. The same arguments thanx.limcan be used.- y.breaks
The breaks to be plotted in the x-axis. Default is
authomatic breaks. The same arguments thanx.breakscan be used.- y.lab
The label of y-axis. Each plot has a default value. New arguments can be inserted as
y.lab = "my label".- leg.position
The position of the legend.
- size.tex.lab
The size of the text in the axes text and labels. Default is
12.- ...
Currently not used..
Author
Tiago Olivoto tiagoolivoto@gmail.com